
Introduction to SilicoScreen
SilicoScreen is a powerful deep learning module designed to predict compound activity against specific biological targets. It leverages a hybrid Graph Neural Network (GNN) architecture, combining Graph Attention Networks (GAT) and Graph Isomorphism Networks (GIN), to achieve high predictive accuracy. By converting SMILES strings into molecular graphs and training on target-specific data, the tool enables the rapid virtual screening of large chemical libraries. This allows researchers to efficiently identify potentially active compounds for experimental validation and accelerate structure-activity relationship studies.
A Step-by-Step Guide to Execute the Tool
Before starting, you must create a JOB ID. You can enter a custom name for your job or click the "Create New Job" button to begin.
TIP: Access to all tool functions is disabled until a JOB ID has been successfully created.
The first step in building your predictive model is to "Upload the training data". This must be a file containing your target-specific SMILES strings and their corresponding binary labels (0 for inactive and 1 for active).
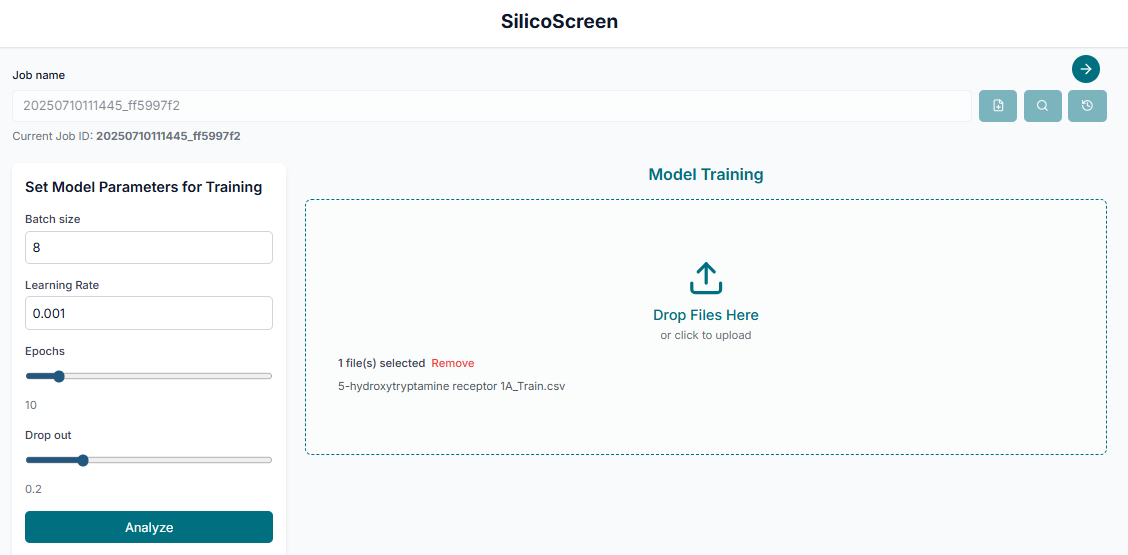
After uploading your data, you can adjust the training parameters if needed. Once you are satisfied with the settings, click the "Start Training" button to begin building the predictive model.
Evaluating the Trained Model
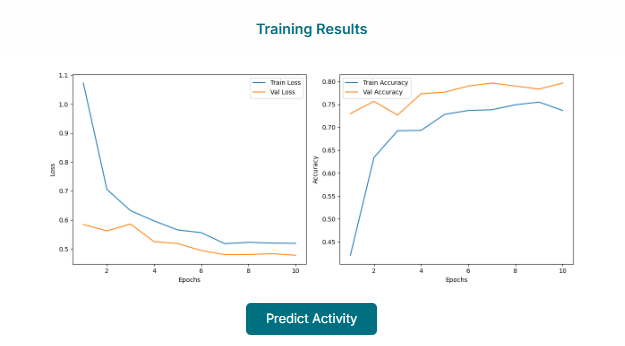
Once the training is complete, the tool will display the model's performance. You can analyze the model performance by visualizing the plots, such as the ROC curve, and reviewing key evaluation metrics to assess its accuracy and reliability.
If you are satisfied that the model performance is good, you can proceed to the next stage. Click the "Predict Activity" button or tab to use your newly trained model for screening.
Screening New Compounds
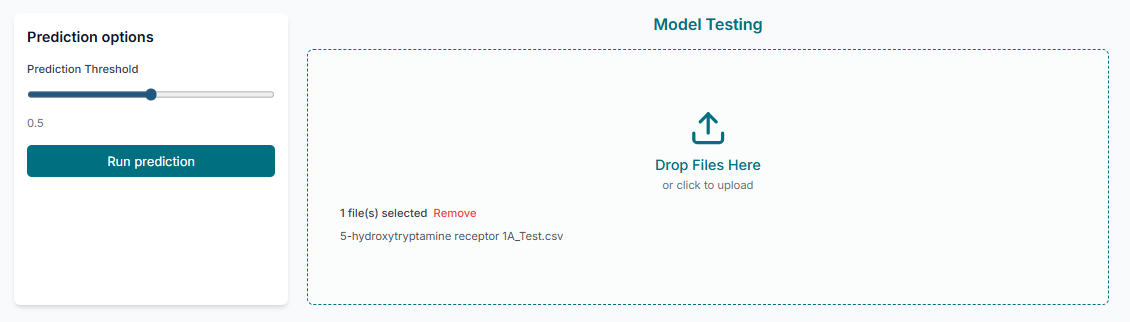
In the prediction section, upload the "prediction data". This file should contain the SMILES strings of the new, unlabeled molecules you wish to screen. After uploading, click the "Start Prediction" button to get their activity predictions.
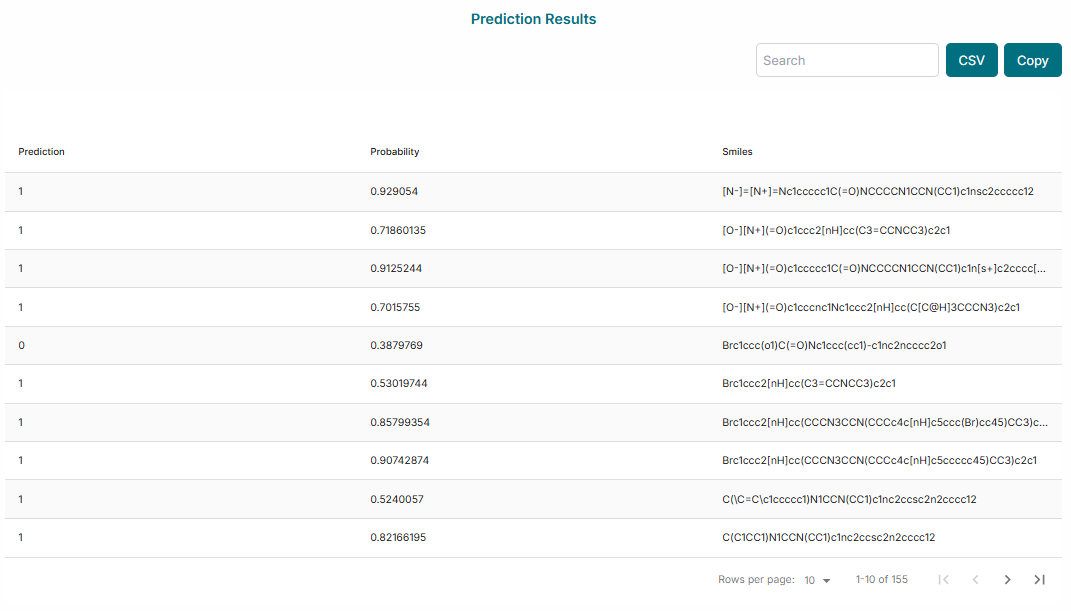
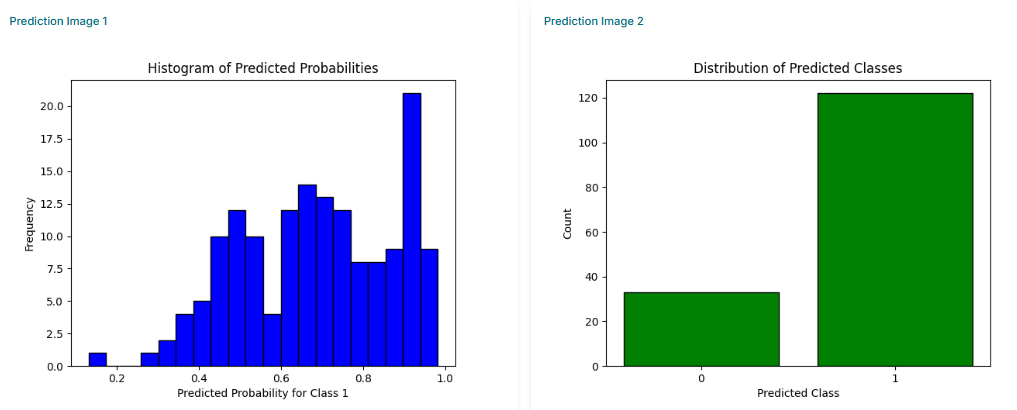
The final results will be displayed on the screen. You can analyze the prediction table, which lists each compound and its predicted class (active/inactive). Additionally, you can analyze the plots to visualize the distribution of prediction probabilities across your dataset.
So, by using the SilicoScreen tool, you have successfully trained a custom predictive model and used it to screen a new set of compounds for potential biological activity.