Introduction to MolVisio
MolVisio is an interactive molecular visualization tool designed to help researchers and students explore the three-dimensional structures of proteins, ligands, and their complexes. It provides a user-friendly platform to view, analyze, and interpret molecular structures, making it especially useful in structure-based drug design and molecular modeling studies.
MolVisio supports common file formats such as PDB, MOL2, and SDF, and allows users to visualize secondary structures, binding sites, ligand poses, and key interactions like hydrogen bonds. With features like zooming, rotation, color customization, and highlighting of specific residues or functional groups, it enhances the clarity of structural interpretations. MolVisio is particularly valuable for examining docking results, preparing publication-quality images, and demonstrating protein–ligand interactions in educational or research settings.
A Step-by-Step Guide to Execute the Tool
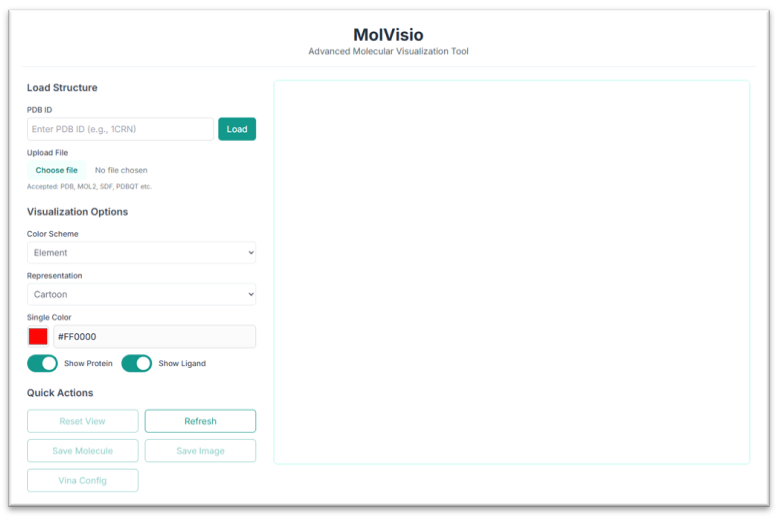
This is the MolVisio tool's application workspace page, where various options for exploring and visualizing molecular structures are displayed. This tutorial will explain each option in detail.
Visualization of the Structure
Using the "Enter PDB ID" option, you can load any structure directly from the PDB database. You can also browse and upload your own file by selecting the "Upload File" option.
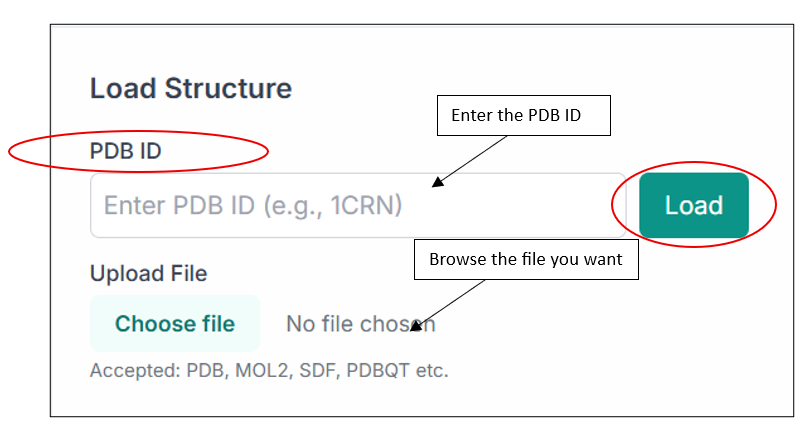
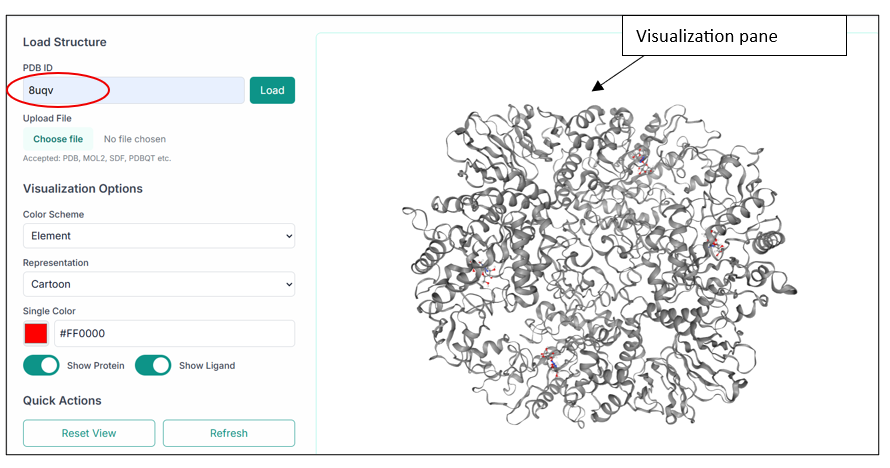
After uploading the file you want to visualize, click on the "Load" button, and you will see your structure in the visualization pane, as shown in the image below.
Customizing Visualization
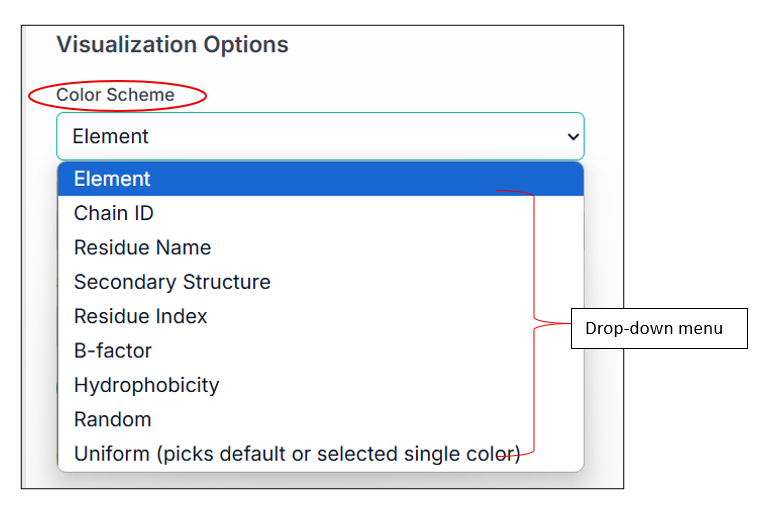
There are a lot of options present here; you can upload any protein-ligand complex, different small molecules, etc., and can visualize them using various customizing options. MolVisio provides various Visualization options, including the choice of color scheme for your compound. You can see multiple available options in the drop-down menu as shown in the image, and can select one of them as per your choice.
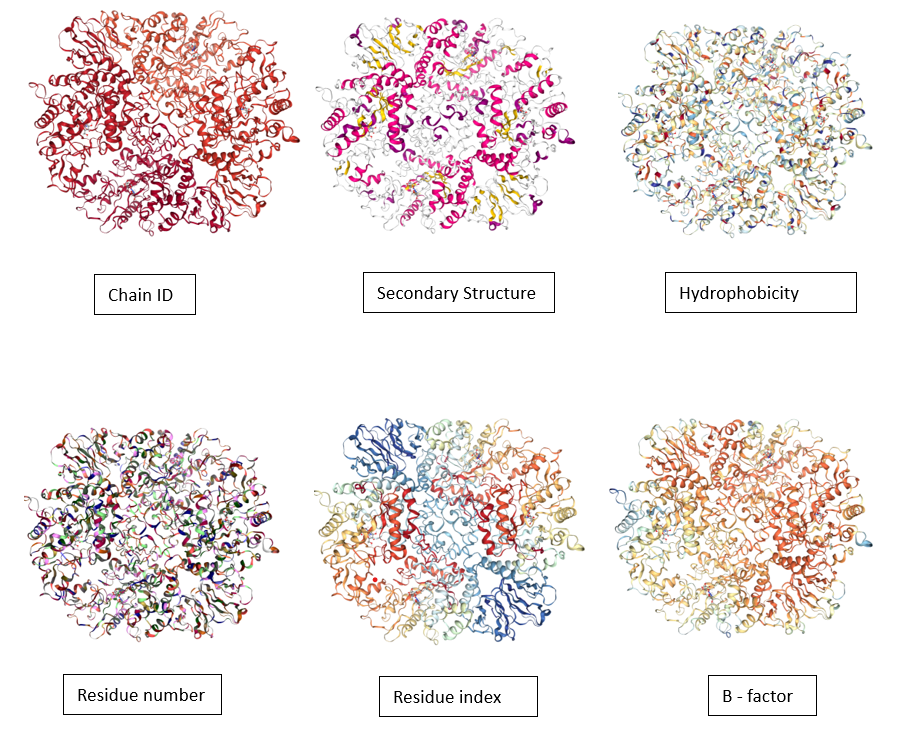
Some of the examples are shown below:
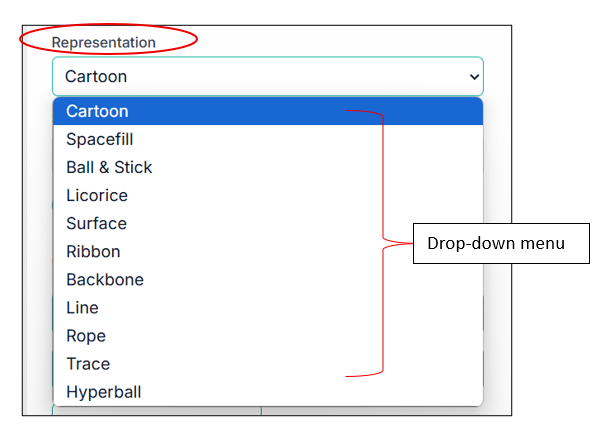
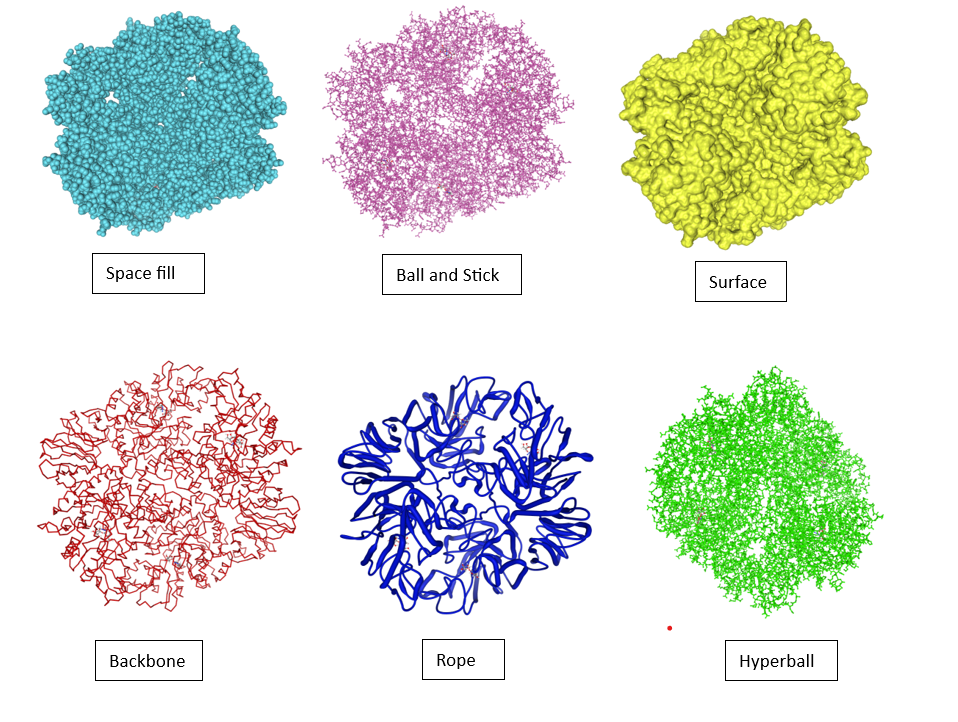
You can also change the representation of your compound; some of the examples are shown below:
Toggling Protein and Ligand Visibility
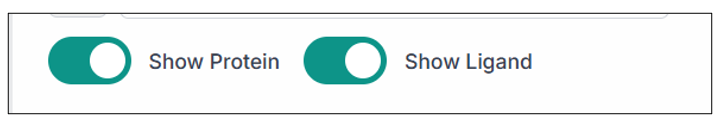
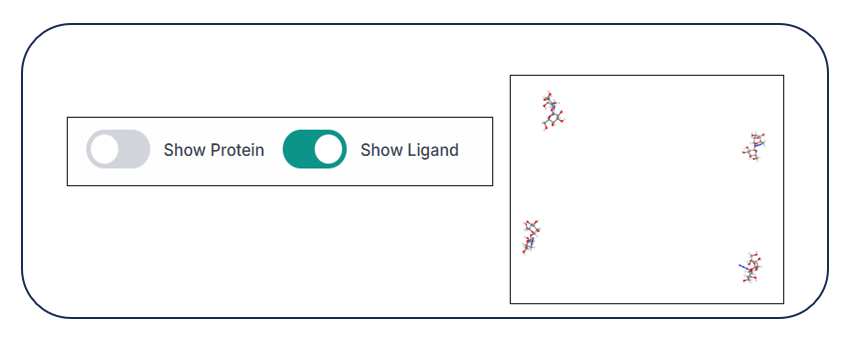
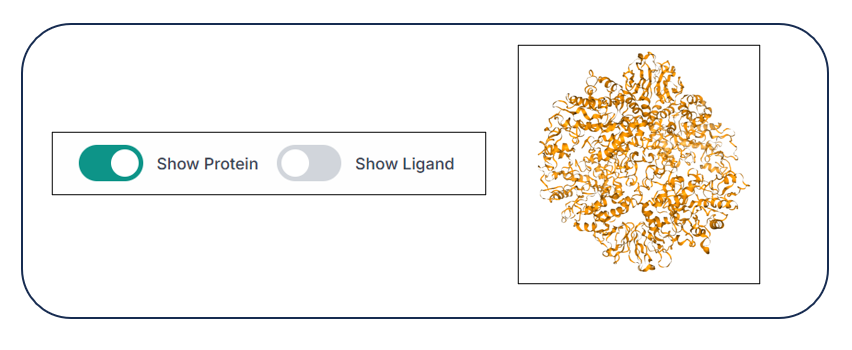
Using the two options, "Show Protein" and "Show Ligand", you can hide and unhide the protein and ligand from the structure just by clicking on the respective buttons, as shown in the image below.
When the protein is hidden, you can see only the ligand(s) in the visualization pane.
When the ligand is hidden, you can see only the protein in the visualization pane.
Quick Actions and Command Line
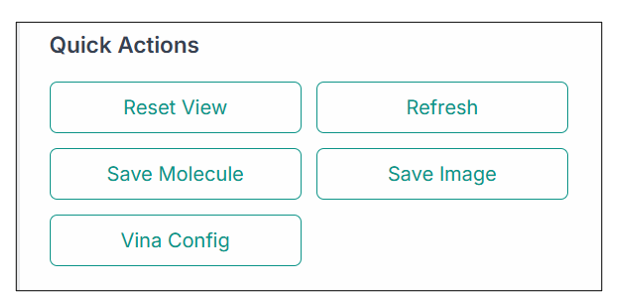
You can use various options from the "Quick Actions" section, as shown in the image below:
- Reset View: To reset the structure to what it was previously.
- Refresh: To clear the current selection and refresh the application.
- Save Molecule: To save the molecule file.
- Save Image: To save the current image on the pane.
- Vina Config: To create the configuration file for docking purposes using the ligand present in the structure.
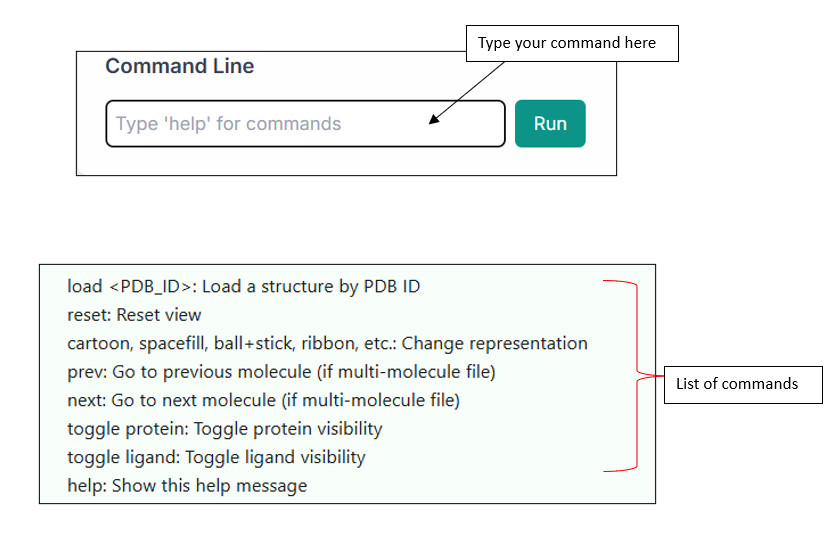
You can also use the "Command Line" option for entering commands and exploring various functionalities of the tool. The list of commands is shown below in the image.