Introduction to BINA DOCK
BINA DOCK is a next-generation molecular docking tool designed for high-throughput virtual screening and accurate binding pose prediction. It leverages an advanced, AI-driven scoring function and a sophisticated conformational search algorithm to precisely evaluate the interactions between small molecule ligands and their protein targets. BINA DOCK helps researchers predict binding affinity (kcal/mol) and visualize the most stable ligand-protein complexes, making it an invaluable asset for drug discovery, lead identification, and structure-activity relationship (SAR) studies. This tutorial will guide you through every step of setting up and running a successful docking simulation with BINA DOCK.
A Step-by-Step Guide to Execute the Tool
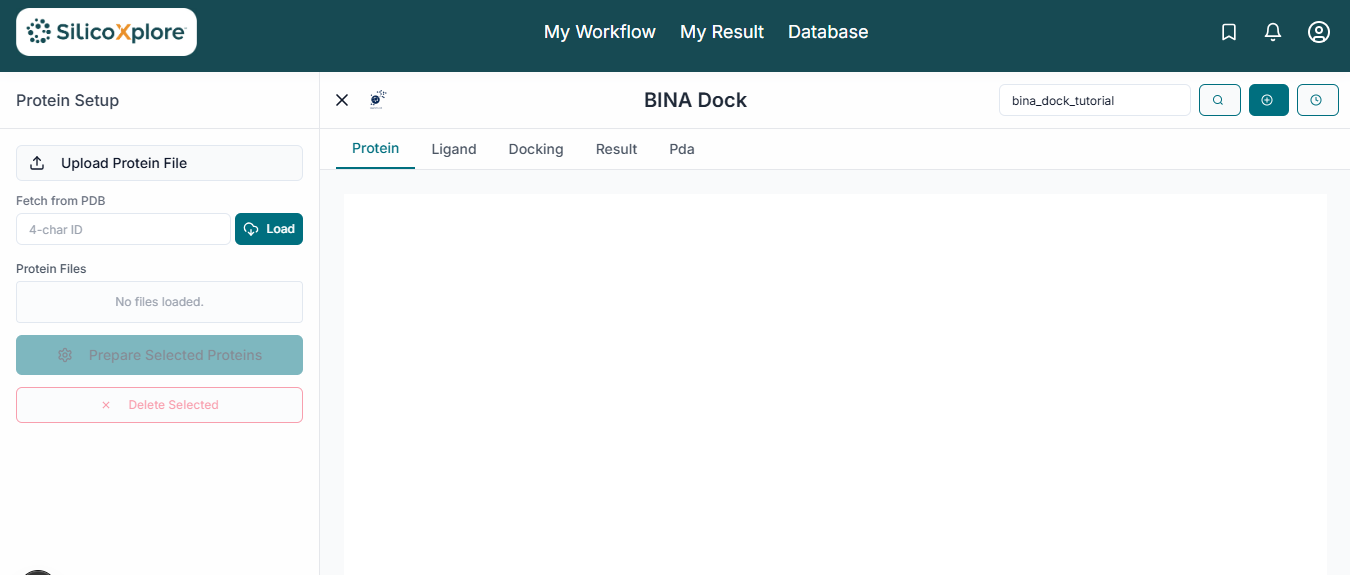
This is the BINA DOCK application workspace. From here, you will upload your files, configure the docking parameters, and analyze the results. This guide will walk you through each section.
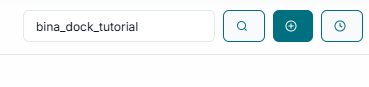
Before executing the tool, you have to mandatorily create a JOB ID. You can customize this ID to your preference, or simply click the "Create Job ID" button to have one generated for you automatically.
TIP: Without creating a JOB ID, you will not be able to access any options of the tool.
Receptor Preparation
In the "File Uploader" section, begin by clicking on the "Upload Receptor" button to browse and select your target protein structure file (e.g., in .pdb format).
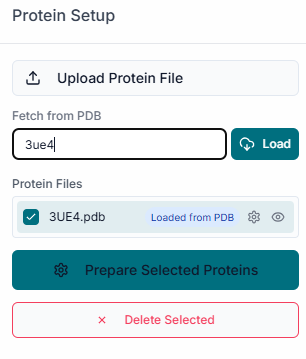
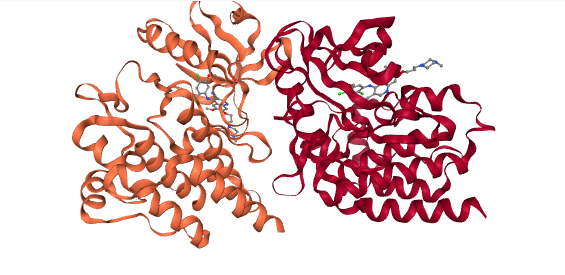
Once the protein is uploaded, its file name will appear in the "Uploaded Receptor" list. The structure will also be automatically displayed in the 3D visualization pane on the right.
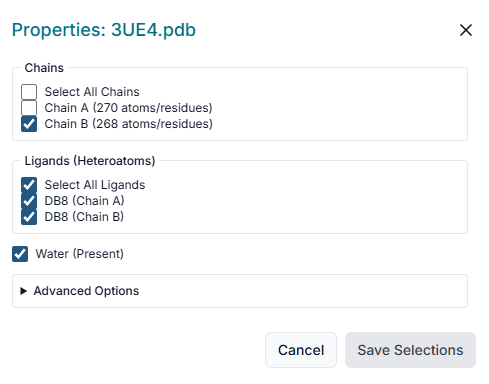
After uploading the receptor, the "Prepare Your Receptor" window will appear. Here, you must prepare the protein by selecting the correct "Chains" and deciding whether to keep or remove existing "Ligands" (Heteroatoms) and "Water" molecules. Once configured, click the "Prepare Selected Proteins" button.
Tip: It is standard practice to remove co-crystallized ligands and water molecules to ensure the binding site is clear for your new ligands.
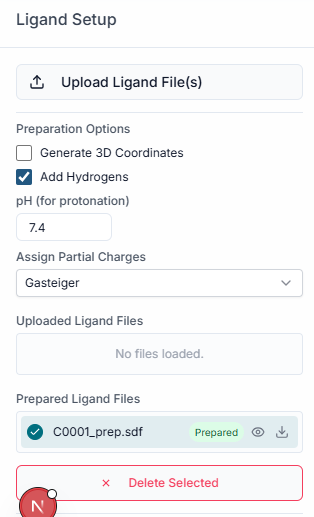
Ligand Preparation
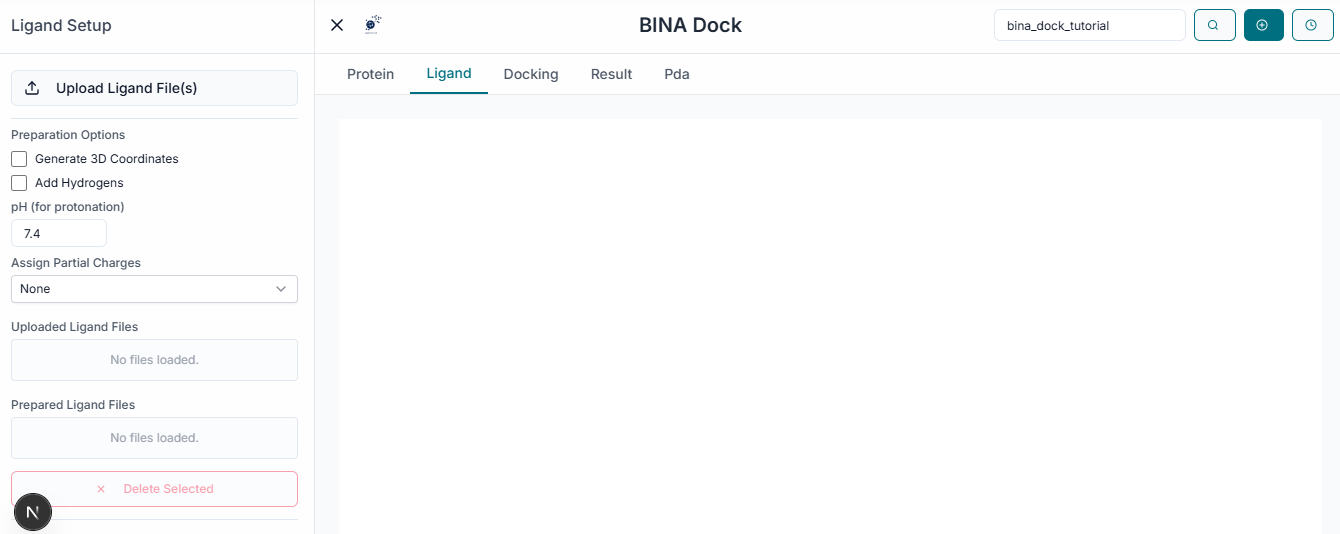
Next, click the "Upload Ligands" button to upload the small molecules you wish to dock. BINA DOCK supports common file formats like .sdf and .smi for ligand input.
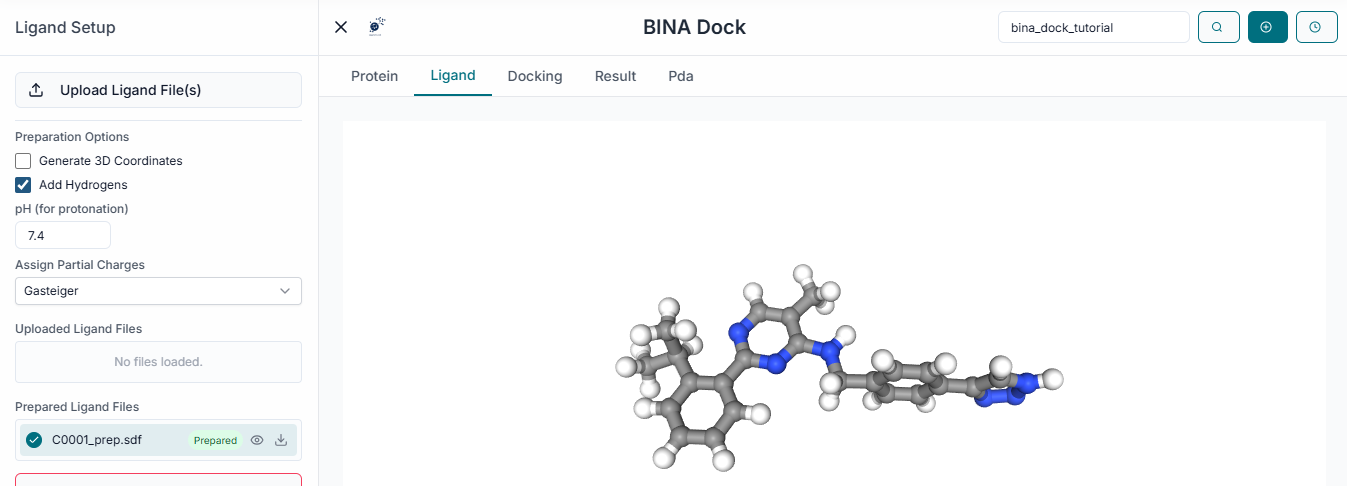
The name of your uploaded ligand file will now appear under the "Uploaded Ligands" section, confirming it has been loaded successfully.
Tip: You can upload a single file containing thousands of ligands to perform a large-scale virtual screening in one job.
From the uploaded list, select the specific ligand file(s) you want to include in the docking run by clicking the checkbox next to the file name.
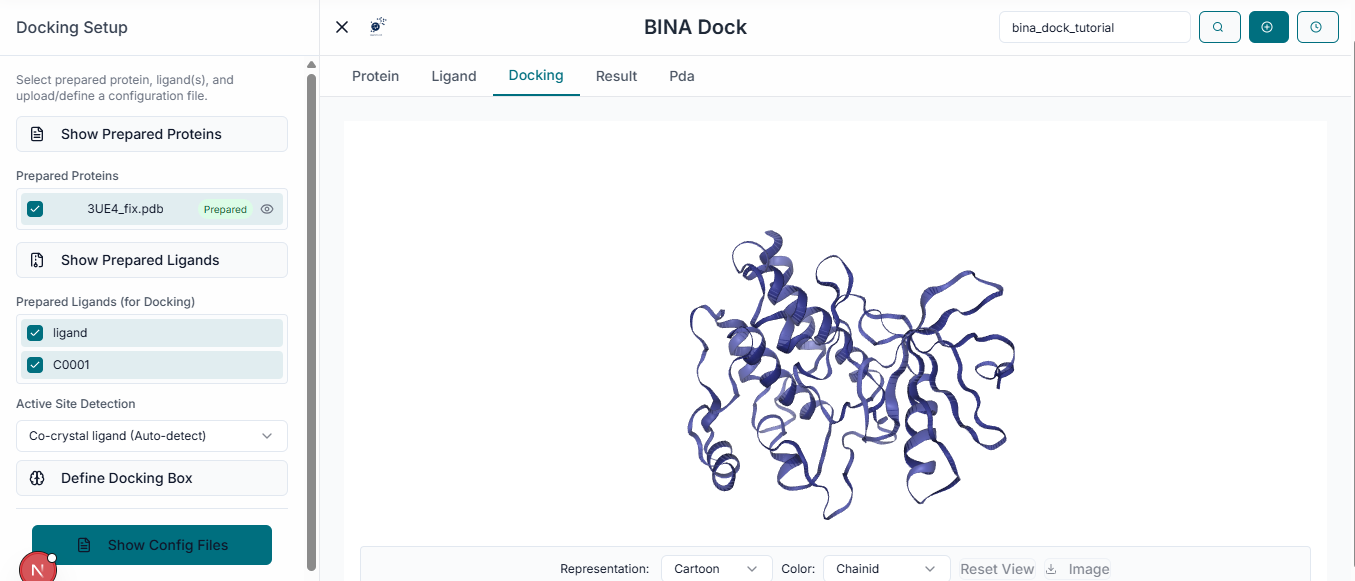
Grid Box Configuration
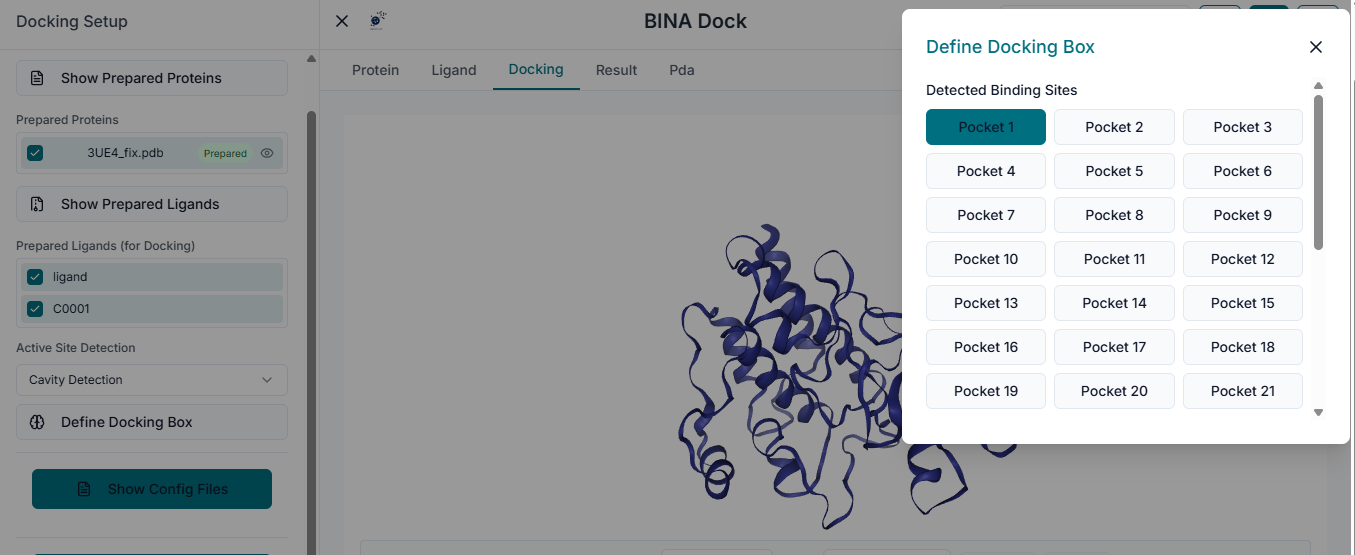
The next crucial step is to define the docking search space. Navigate to the "Binding Site Configuration" section on the left side of the workspace.
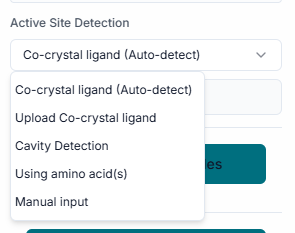
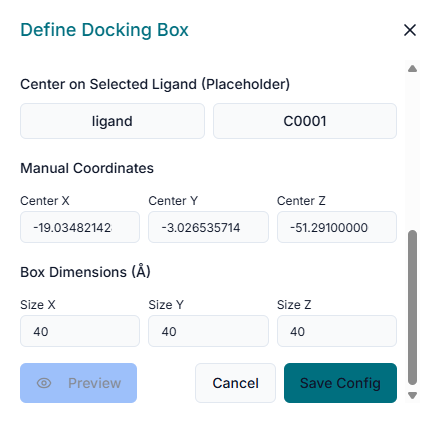
In the provided fields, enter the "Center Coordinates" (X, Y, Z). This point defines the geometric center of the binding pocket you are targeting for the docking simulation. Next, specify the "Dimensions" (X, Y, Z) of the search space. These values define the size of the box around the center point where BINA DOCK will search for binding poses. As you enter the coordinates and dimensions, a transparent grid box will appear in the 3D viewer. This allows you to visually inspect and adjust the box to ensure it correctly encompasses the entire binding site of the protein.
Running the Docking Simulation
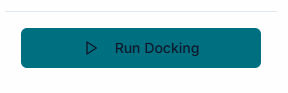
With the receptor prepared, ligands selected, and the binding site defined, you are ready to begin. Click the "Run Docking" button at the bottom to start the simulation.
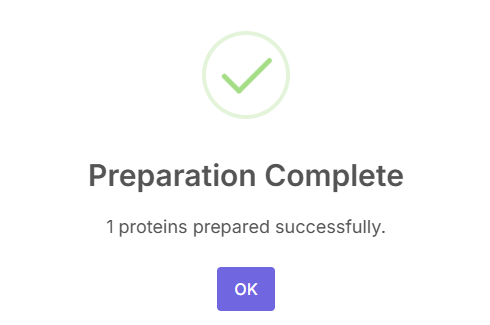
The docking status will be displayed in a pop-up.
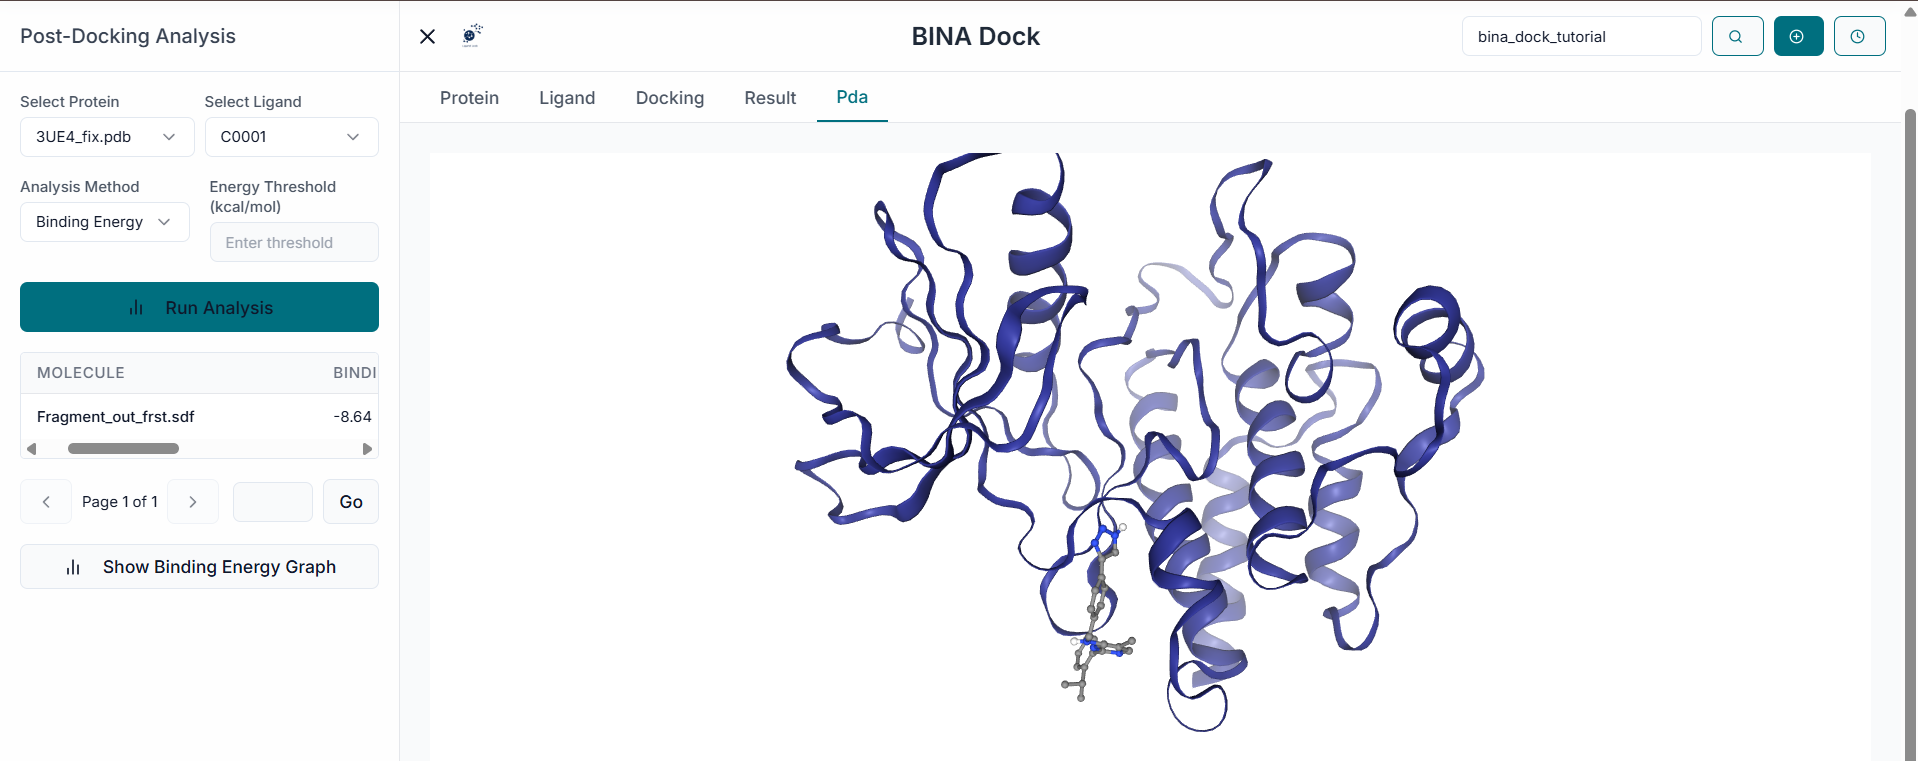
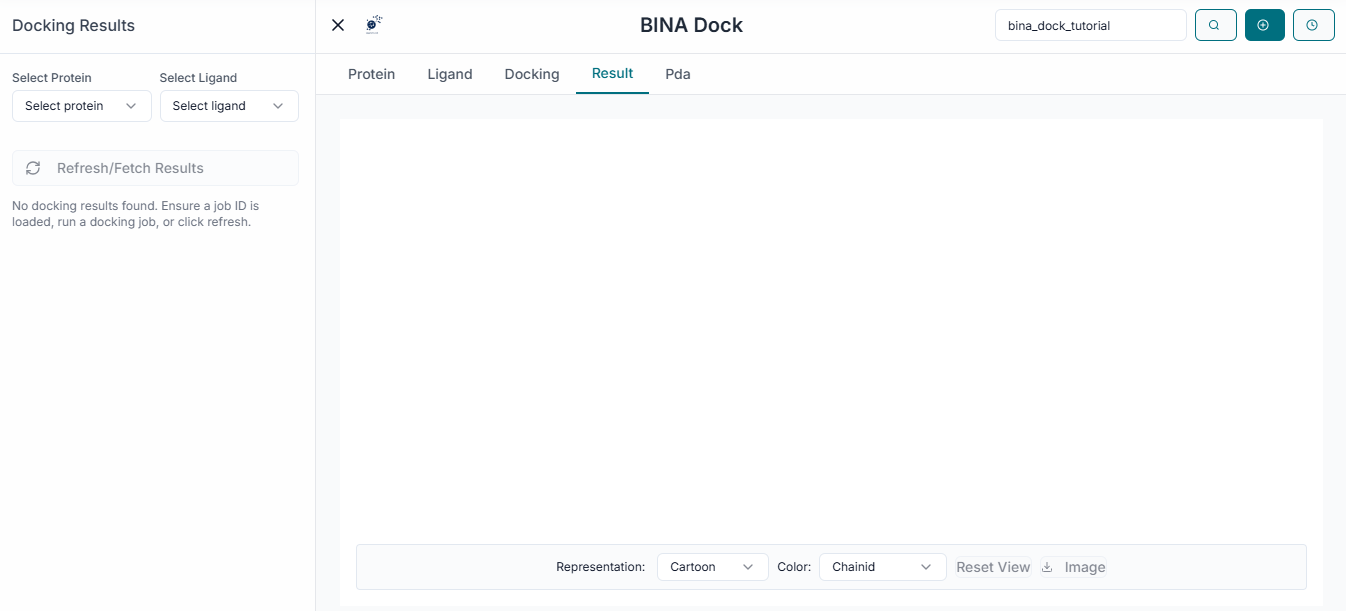
Analyzing the Docking Results
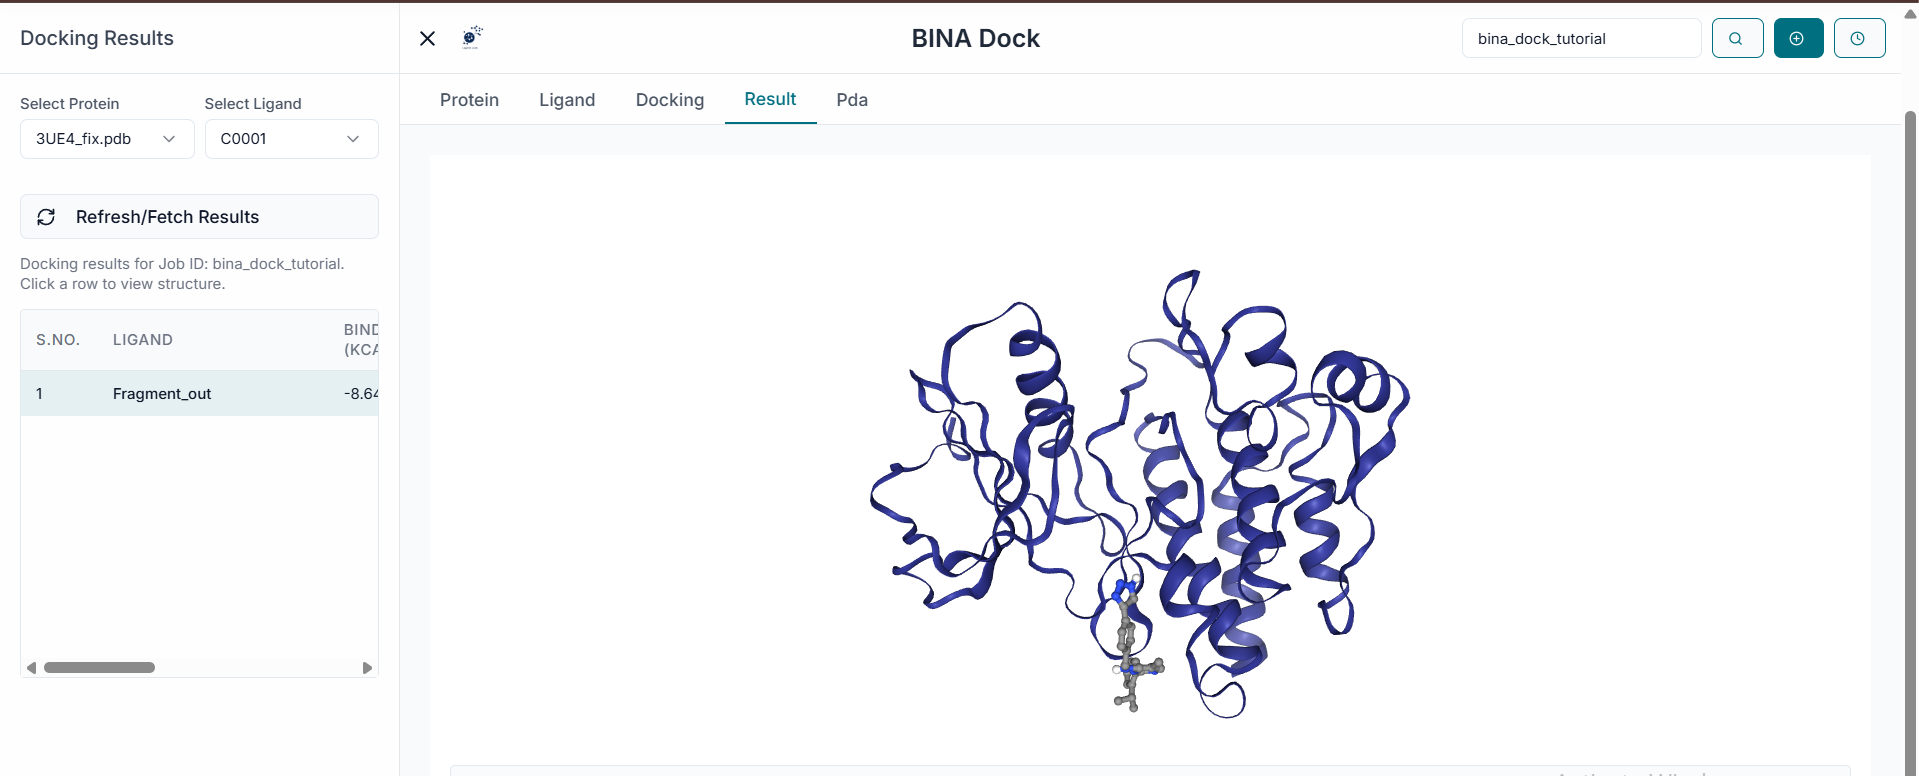
Once the simulation is complete, the "Results Table" will be populated. This table displays each docked ligand along with its predicted Binding Affinity (kcal/mol) and other relevant metrics. You can sort the results by clicking on the column headers. For instance, clicking on "Binding Affinity" will reorder the list from the strongest binding (most negative value) to the weakest, helping you quickly identify the top candidates.
To visualize a specific binding pose, simply click on its corresponding row in the results table. The selected ligand will immediately be shown in its predicted pose within the protein's active site in the 3D viewer.
Downloading Results, Poses, and Graphs
To save the 3D structures of the best poses, select the desired rows in the table and click the "Download Pose(s)" button. This will download the coordinates of the selected ligand-protein complexes in .pdb format for further analysis.
For a quick graphical summary, BINA DOCK provides a "Binding Energy Analysis" chart. This bar chart allows for easy visualization and comparison of the binding affinity scores for your docked compounds. The chart can be saved as an image file for reports or presentations by clicking the "Download Graph" button.