
Introduction to PharmFrag
A pharmacophore is a theoretical model that represents the essential features of a molecule required for biological activity, especially for binding to a specific target, like a protein or enzyme. It maps key interaction points that can be used to identify or design potential drug candidates.
PharmFrag is a pharmacophore feature extraction tool designed to identify and analyze the key interaction features essential for ligand binding. Built on the key pharmacophore features framework, it systematically detects crucial elements like hydrogen bond donors/acceptors, aromatic rings, hydrophobic regions, and ionizable groups from molecular structures. These features represent the core pharmacophoric patterns responsible for biological activity.
PharmFrag employs a deep-learning-based algorithm and uses RDKIT for mining the features.
A Step-by-Step Guide to Execute the Tool
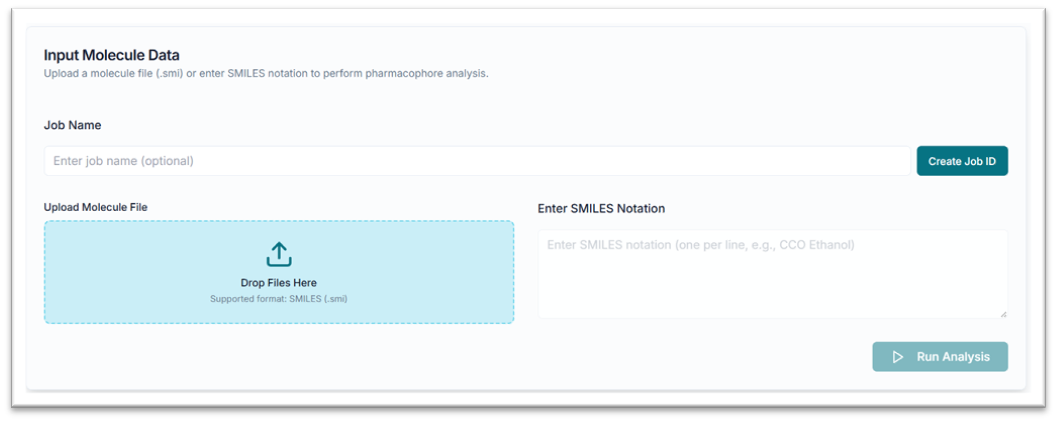
Before executing the tool, you must create a Job ID. You can customize this ID or click the "Create Job ID" button to have one generated for you automatically.
TIP: Without creating a JOB ID, you will not be able to access any options of the tool.

This is the PharmFrag tool's application workspace page, where various options for exploring and generating pharmacophore features are displayed.
Generating Features via SMILES (.smi) File
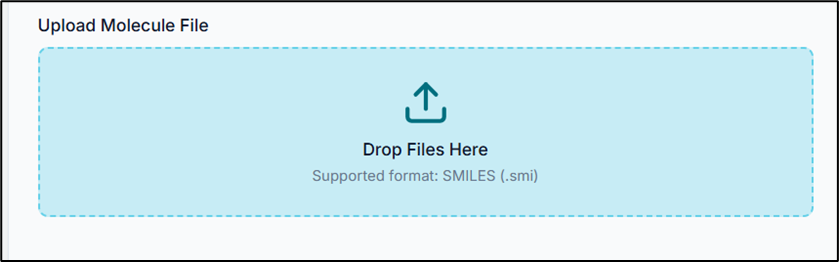
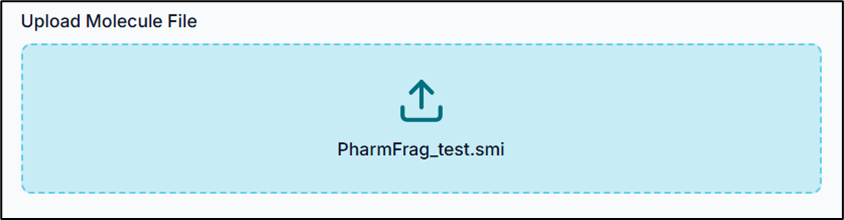
From the "Upload Molecule File" tab, click on the "Drop Files Here" or "Browse the .smi file" option to upload your file.
Your input .smi file should contain your compound SMILES and their respective names/IDs, in a format similar to the one shown below.
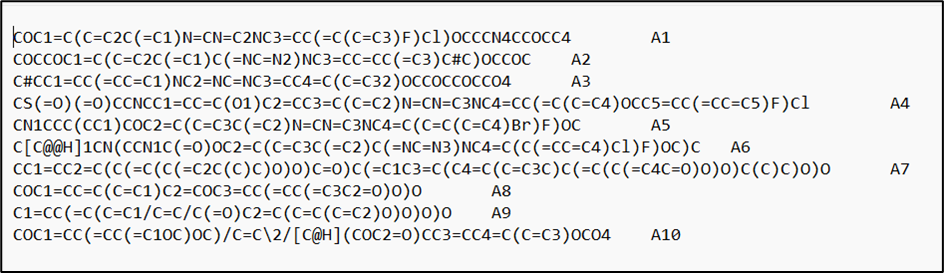
Tip: The SMILES string and the compound name should be TAB-separated.
Generating Features via Pasting SMILES
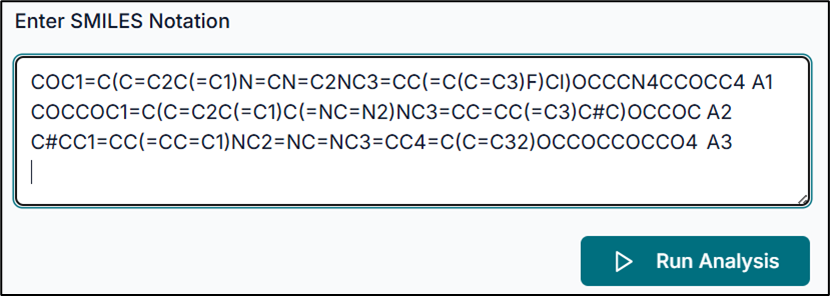
Alternatively, you can use the "Enter SMILES Notation" tab to paste your SMILES string(s) directly.
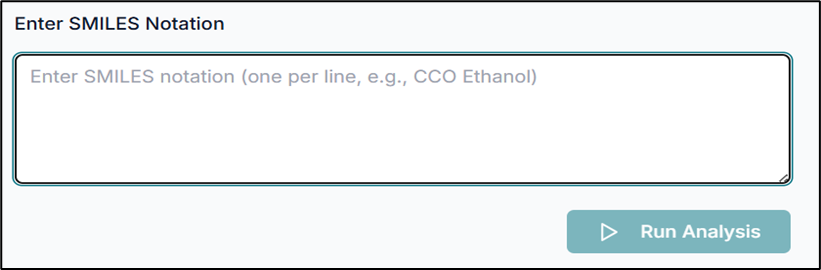
After pasting your SMILES, click the "Run Analysis" button to start the prediction.
Understanding the Results Tab
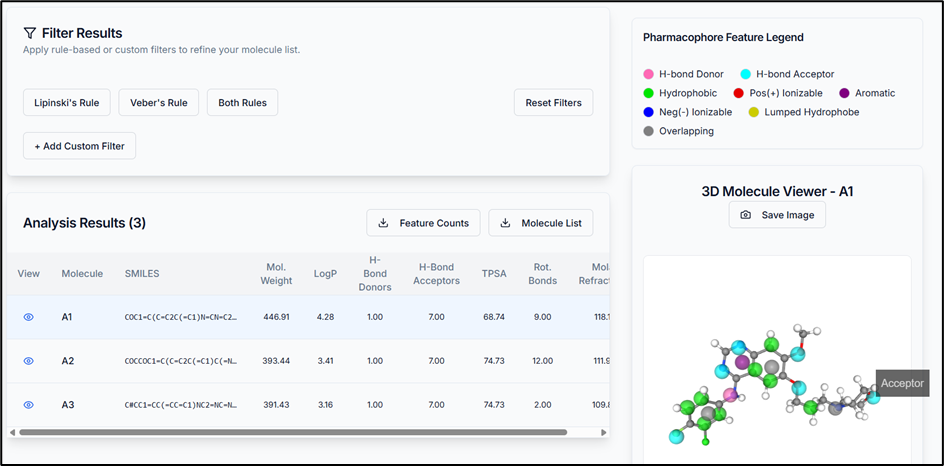
Once the predictions are complete, the results appear in the workspace. The view has three key areas:
- Filter Results: Use physicochemical properties to filter your results.
- Results Section: A detailed table of your compounds. Click the view icon to visualize a molecule. Options to download feature counts and the full (or filtered) molecule list are here.
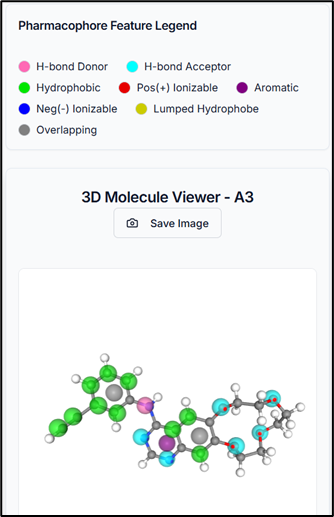
- 3D Molecule Viewer: Interactively view your compounds with their pharmacophoric features highlighted.
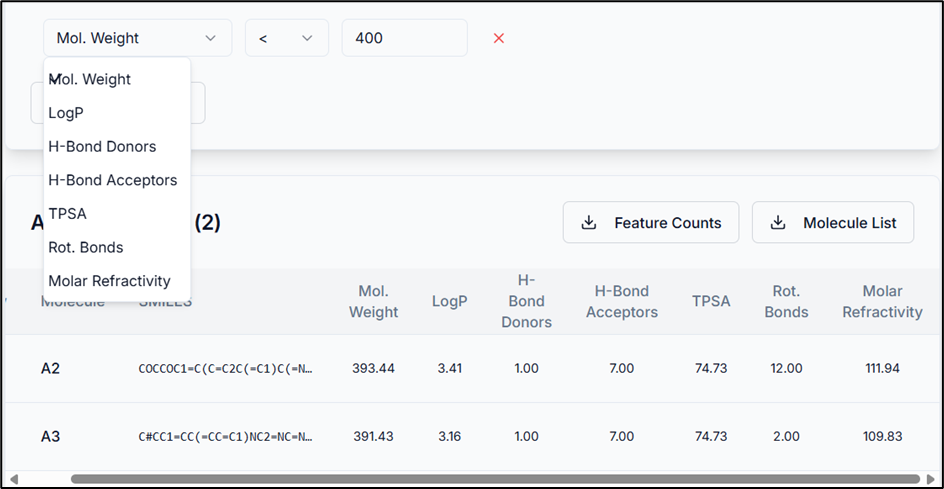
Using Custom Filters
You can use the "Add Custom Filter" option to sort the results. Select a physicochemical property, an operator, and a cutoff value as required.
Feature Counts and Interactive Visualization
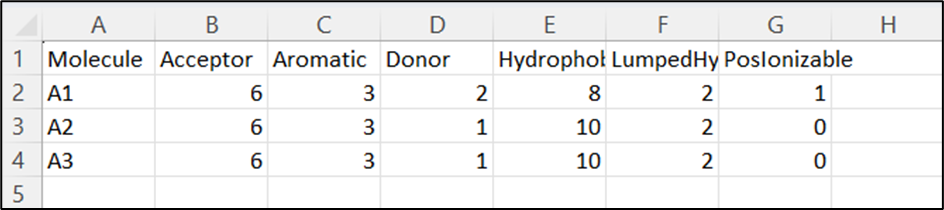
The Feature Counts table provides a summary of the total count of each pharmacophoric feature found in your results.
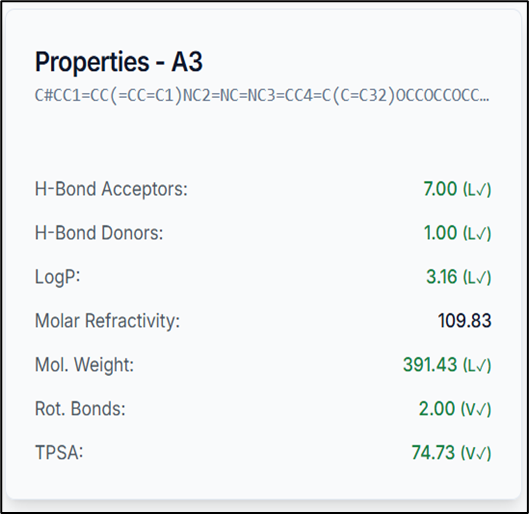
When you select a compound from the results table, it is immediately visualized in the 3D molecule viewer, and its specific properties are displayed. This allows for rapid inspection of pharmacophoric features on the molecular structure.
So, by using the PhramFrag tool, the pharmacophoric features of the compounds have been generated successfully.