Introduction to LigandLock
Welcome to the official tutorial for LigandLock, a powerful and widely-used molecular docking software. LigandLock is an essential tool in modern drug discovery, designed specifically for the virtual screening of small molecules against protein targets. It excels at predicting how potential drug candidates will bind to a protein, providing crucial insights into their interaction. By accurately calculating binding affinity and predicting the most favorable binding pose, LigandLock helps researchers rapidly identify promising compounds from vast chemical libraries for further investigation.
At its core, LigandLock employs a sophisticated algorithm that integrates a robust empirical scoring function with a flexible receptor docking simulation. Using a combination of Monte Carlo methods and gradient-based optimization, it performs a thorough conformational search to find the ideal ligand pose within the target's binding site. The key results include a quantitative binding affinity score (kcal/mol) and the final 3D coordinates of the ligand-protein complex. This tutorial will guide you through setting up, running, and analyzing your first LigandLock simulation.
A Step-by-Step Guide to Execute the Tool
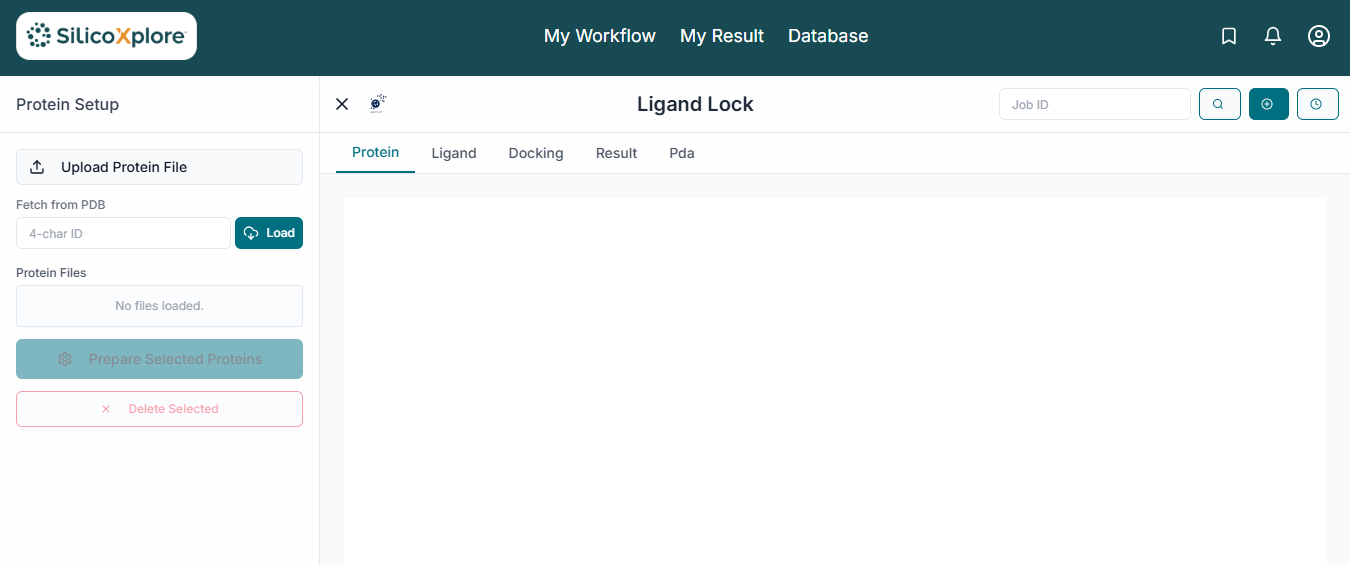
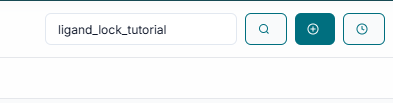
Before executing the tool, you have to mandatorily create a JOB ID, which you can customize as per your choice, or else just by clicking on the Create Job ID button, the job ID will be created by the tool on its own.
TIP: Without creating a JOB ID, you will not be able to access any options of the tool.
Receptor Preparation
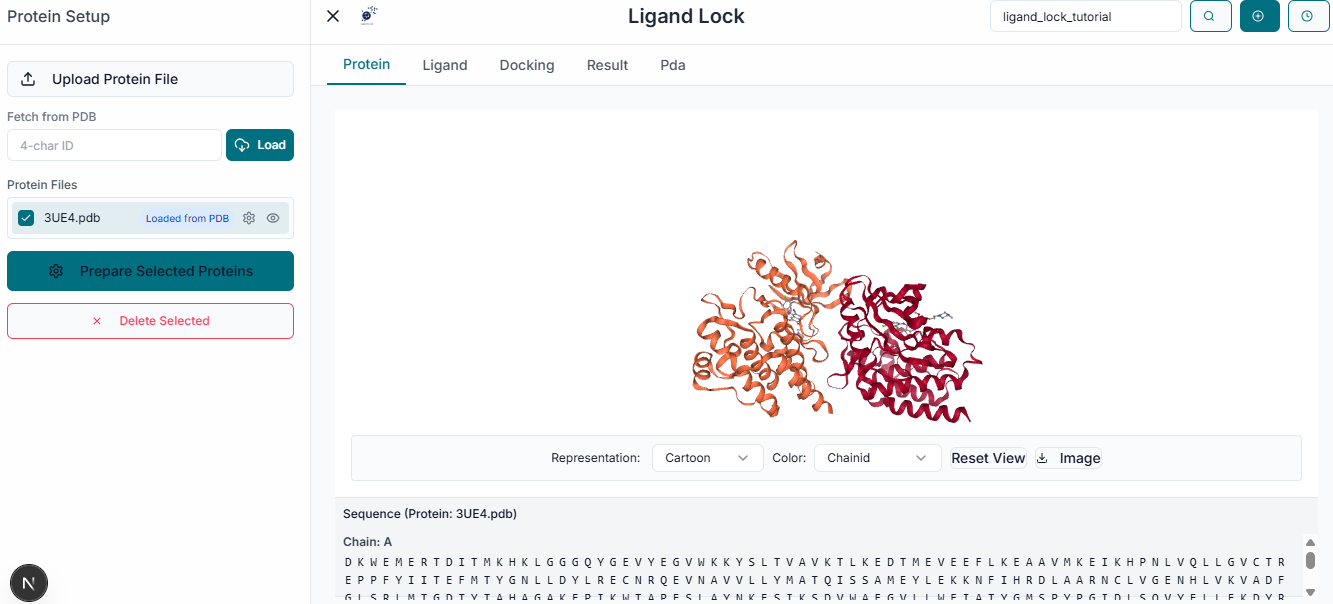
In the File Uploader section, begin by clicking on the "Upload Receptor" button to browse and upload your target protein structure.
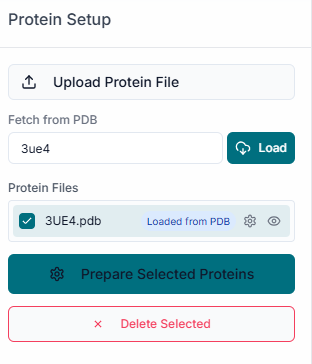
Once the protein is uploaded, its file name will appear in the list under the "Uploaded Receptor" section, confirming it has been loaded successfully. The uploaded protein structure will automatically be displayed in the 3D visualization pane on the right side of the workspace.
After uploading the receptor, a properties window will appear, allowing you to prepare the protein for docking. Here, you can select the specific "Chains" to use and choose whether to keep or remove existing "Ligands" (Heteroatoms) and "Water" molecules. Under "Advanced Options", it is recommended to keep the "Repair protein" option checked to fix any missing atoms or structural issues.
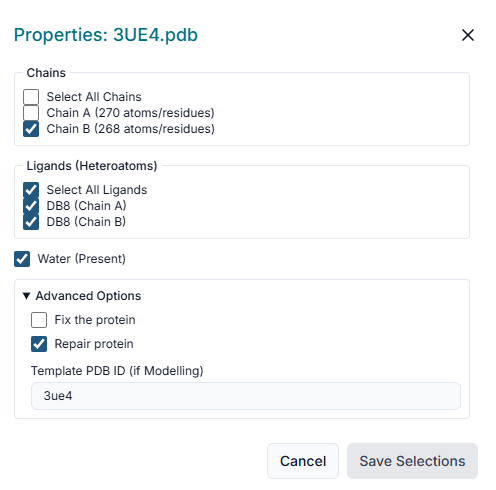
TIP: It is common practice to remove co-crystallized ligands and water molecules to clear the binding site for the new ligands you intend to dock.
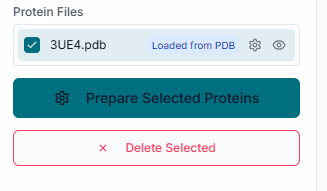
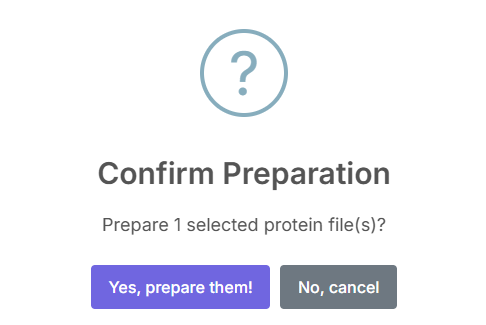
Once you have configured these settings, click the "Prepare Selected Proteins" button to proceed.
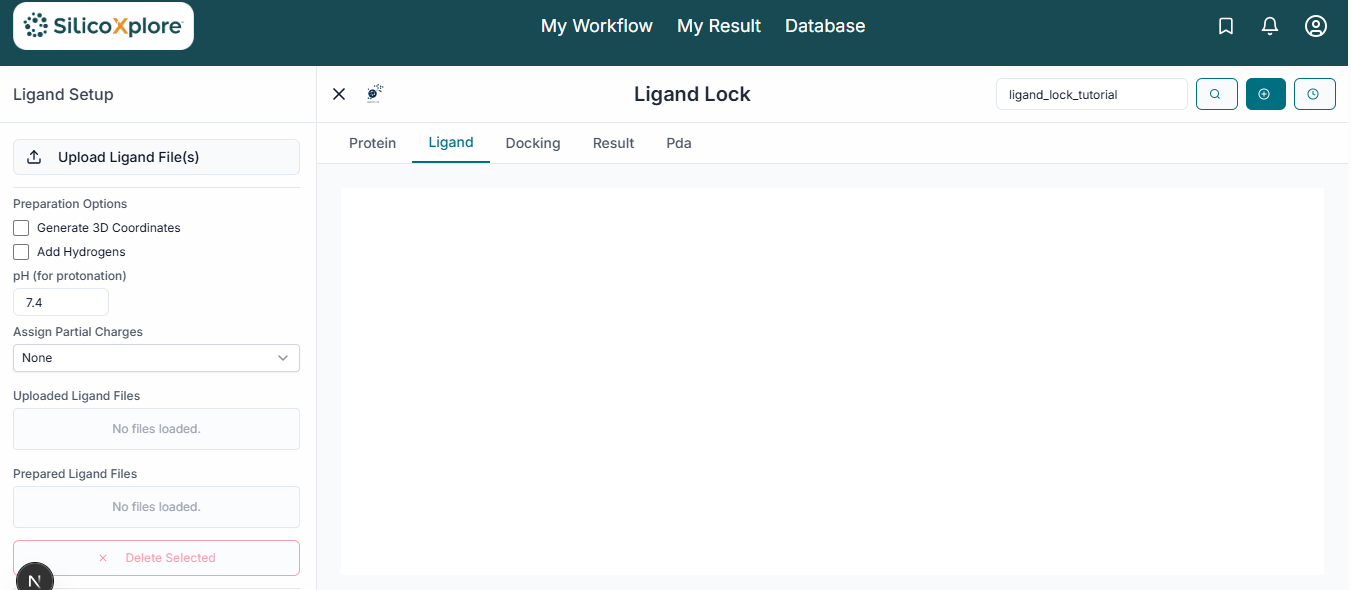
Ligand Preparation
Next, upload your small molecules for docking by clicking the "Upload Ligands" button. LigandLock accepts common chemical file formats like .smi and .sdf.
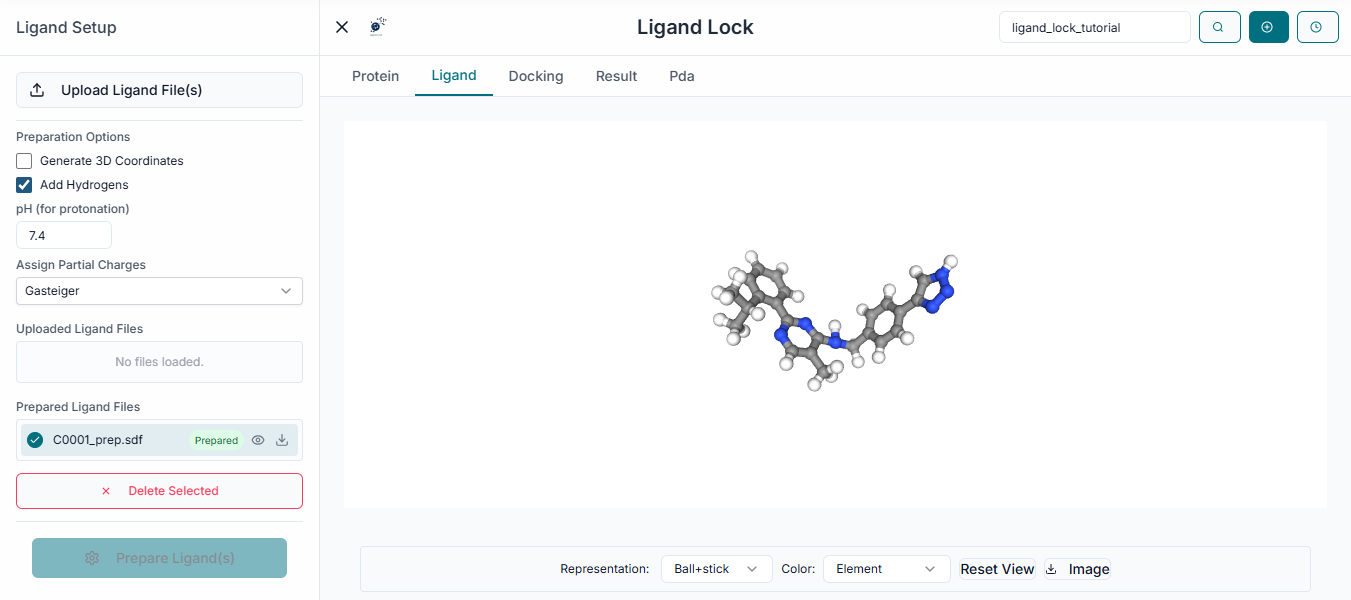
The name of your uploaded ligand file will now appear in the list under the "Uploaded Ligands" section.
Tip: You can upload a single file containing thousands of ligands to perform a large-scale virtual screening in one job.
From the uploaded list, select the specific ligands you wish to include in the docking run by clicking the checkbox next to each one.
Grid Box Configuration
The next crucial step is to define the search space for docking. Navigate to the "Grid Box Configuration" section on the left.
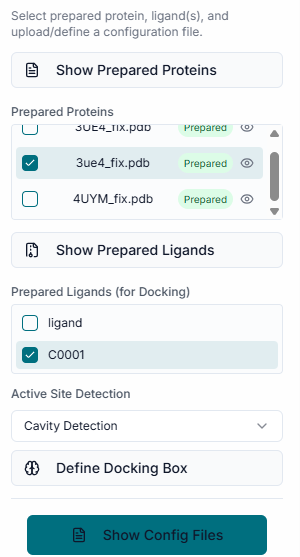
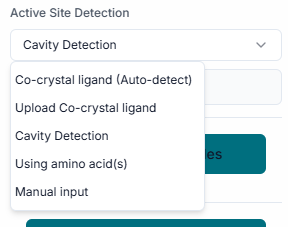
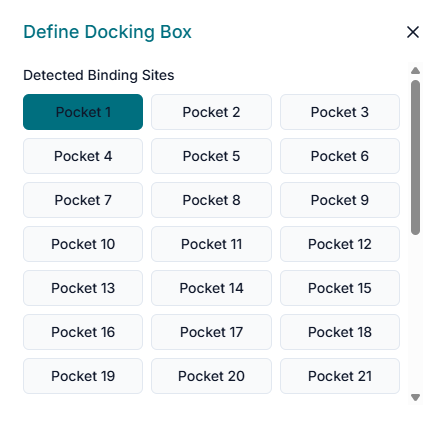
Select any method for fetching the binding site for docking and also select the desired pocket.
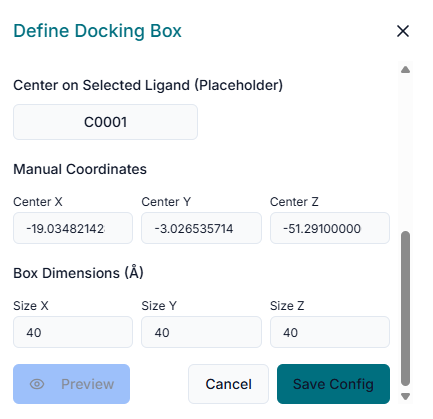
In the provided fields, enter the "Center Coordinates" (X, Y, Z). This point defines the geometric center of the binding pocket you are targeting. Next, specify the "Dimensions" (X, Y, Z) of the search space. These values define the size of the box around the center point where LigandLock will search for binding poses.
Running the Docking Simulation
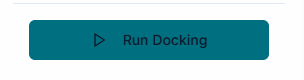
With the receptor uploaded, ligands selected, and the grid box defined, you are ready to start the docking simulation. Click the "Run Docking" button at the bottom.
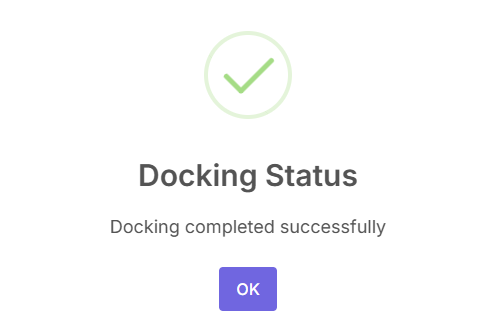
A pop-up will show the docking status.
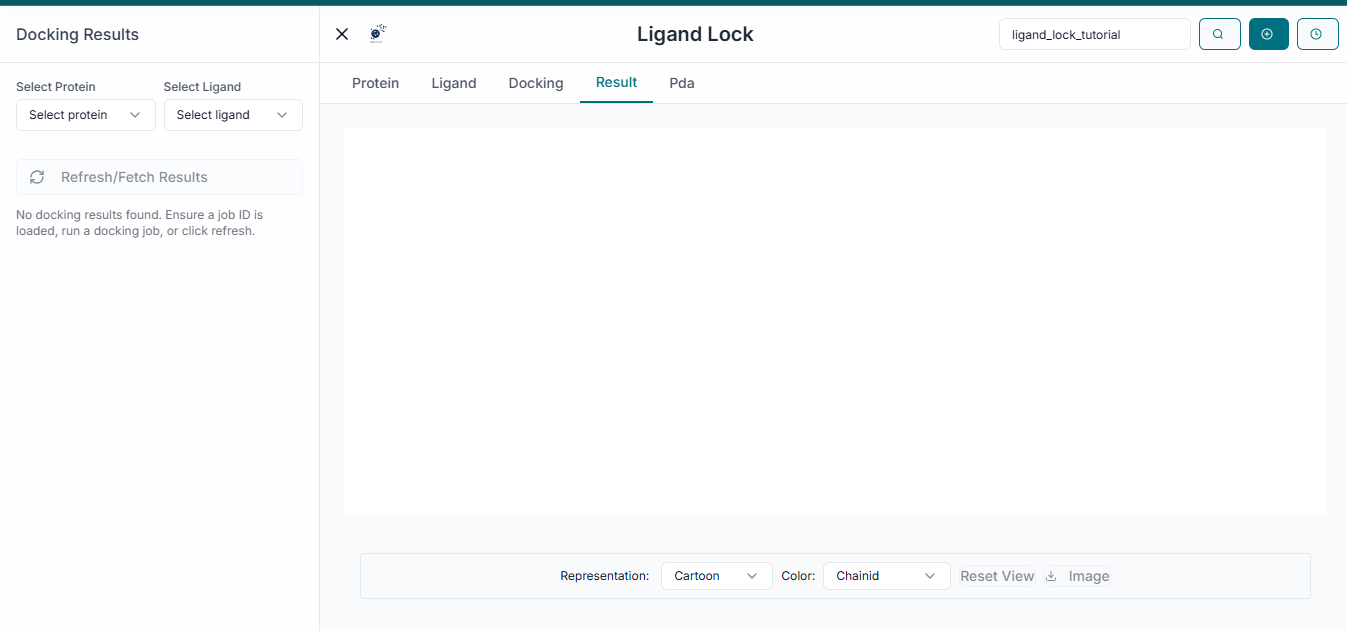
Analyzing the Docking Results
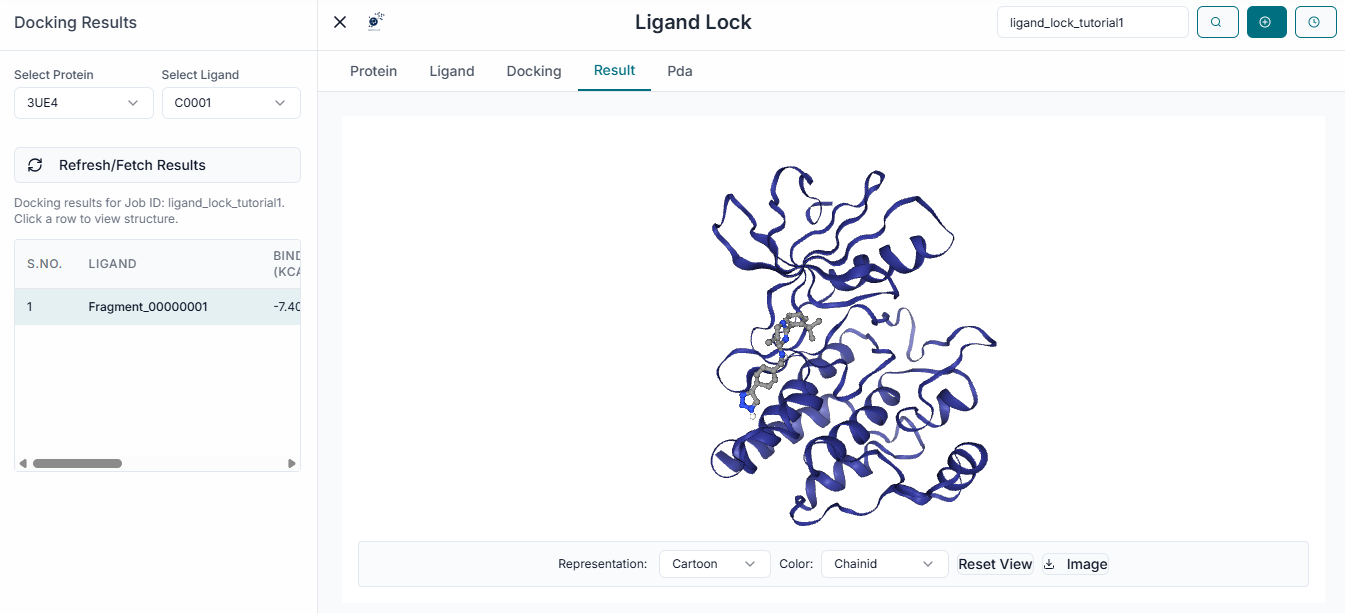
Once the simulation is complete, the "Results Table" will be populated. This table displays each docked ligand along with its predicted Binding Affinity (kcal/mol).
You can sort the results by clicking on the column headers. For example, clicking on "Binding Affinity" will reorder the list from the strongest binding (most negative value) to the weakest.
To visualize a specific binding pose, simply click on the corresponding row in the results table. The selected ligand will immediately be displayed in its predicted binding pose within the protein's active site in the 3D viewer. Use the viewer controls to zoom in and closely examine the ligand's orientation and potential interactions.
Downloading Results, Poses, and Graphs
To save the numerical results for your records, click the "Download Results" button. This will download a zip folder containing the full results table with ligand names and their binding affinity scores along with docked structural files. To save the 3D structures of the best poses, select the desired rows in the table and click the "Download Pose(s)" button.
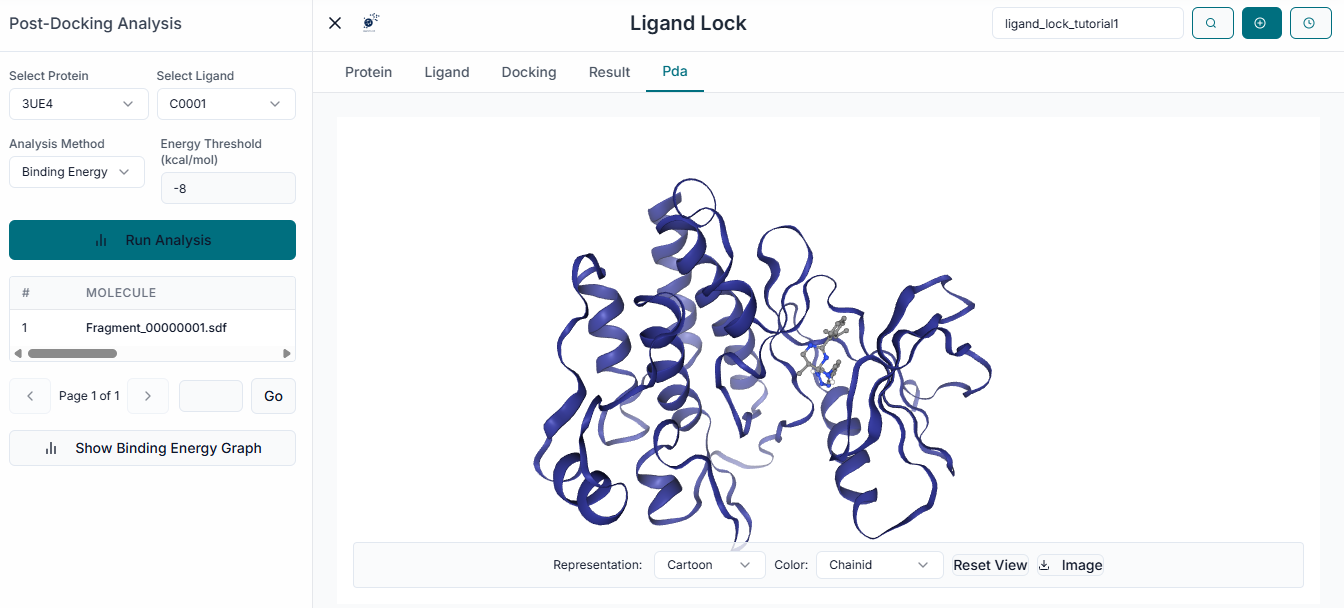
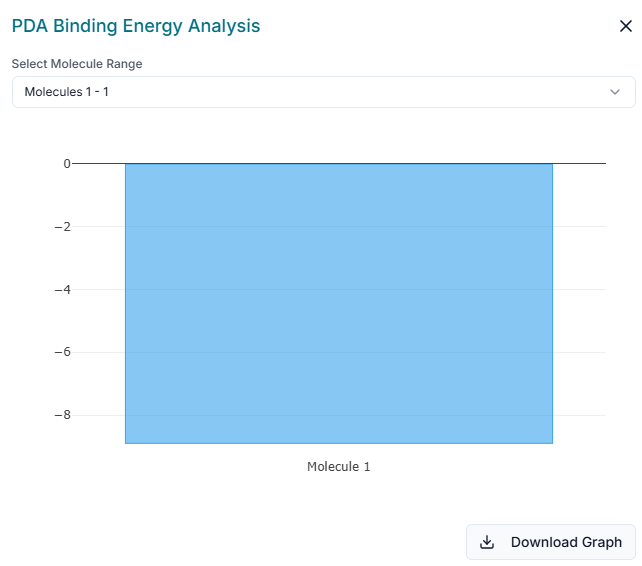
For a quick graphical summary of your results, LigandLock provides a PDA Binding Energy Analysis chart. This window displays a bar chart that allows for easy visualization and comparison of the binding affinity scores for your docked compounds. You can use the "Select Molecule Range" dropdown to focus on specific molecules from your library. The chart can be saved as an image file for your reports or presentations by clicking the "Download Graph" button.